Explore, process and visualize any data, just by describing it.
NVEIL is an open-source AI platform for the whole data workflow. Ask in plain language; it handles the data processing and the visualization for you.
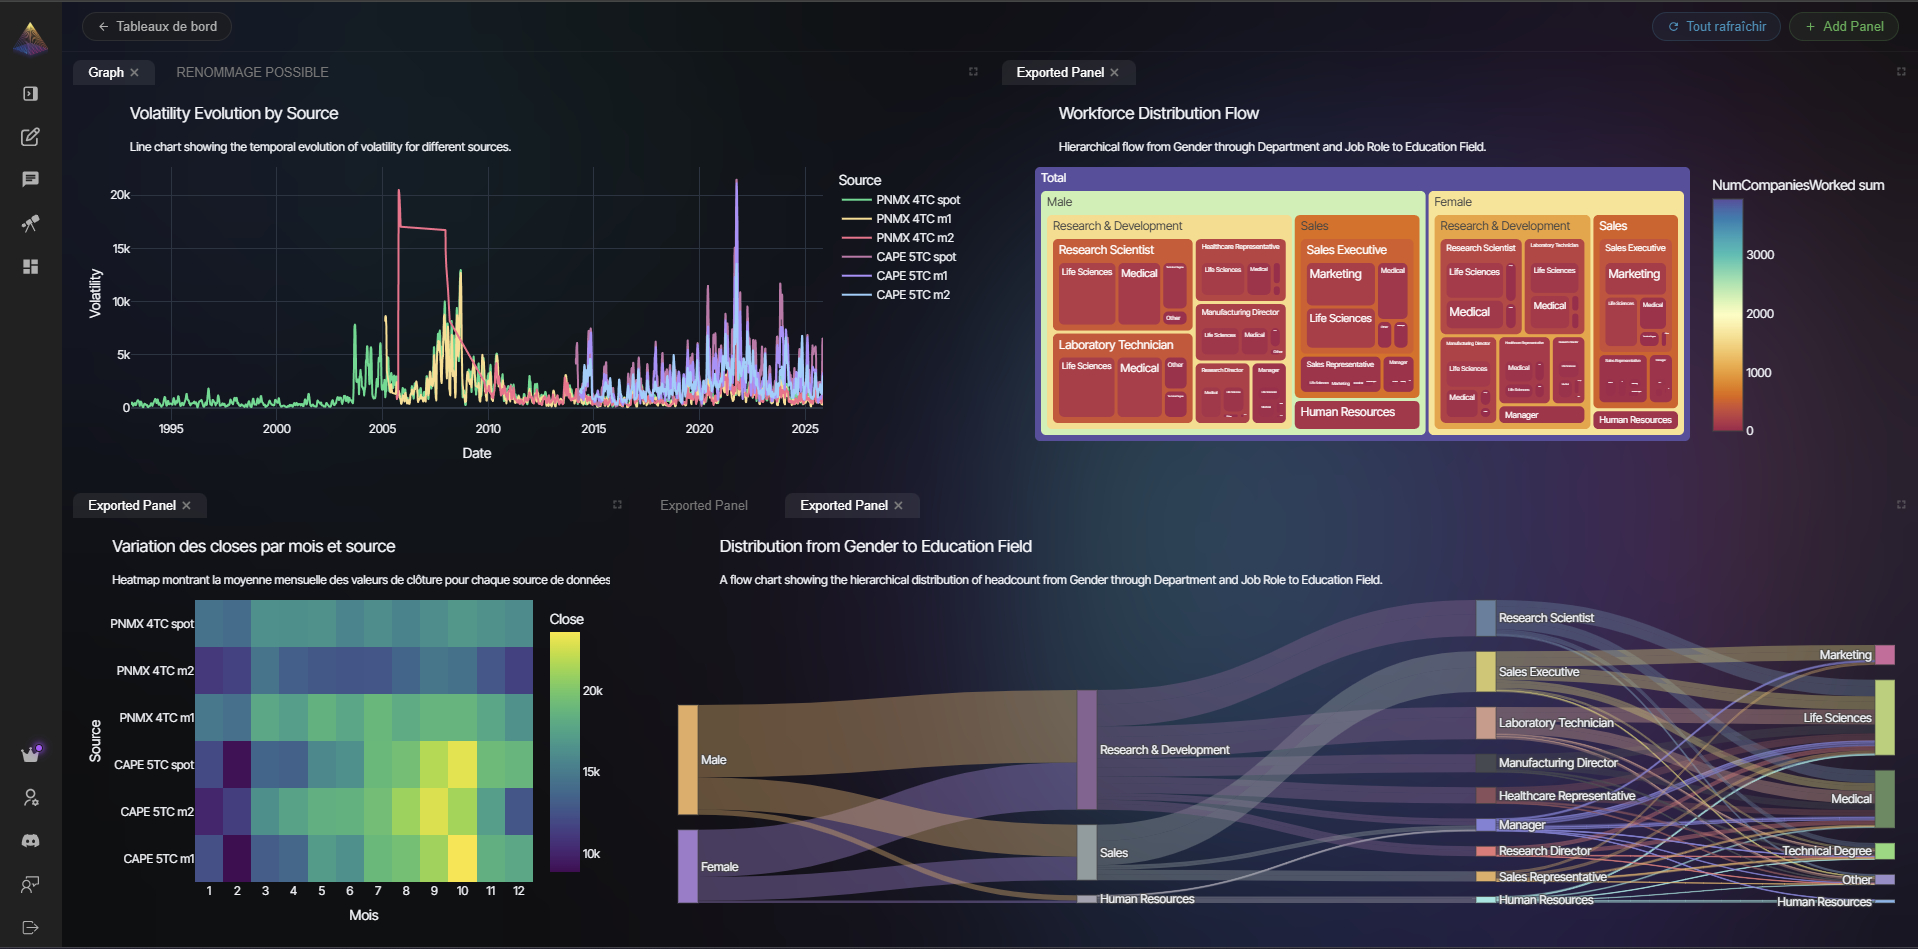
What is NVEIL?
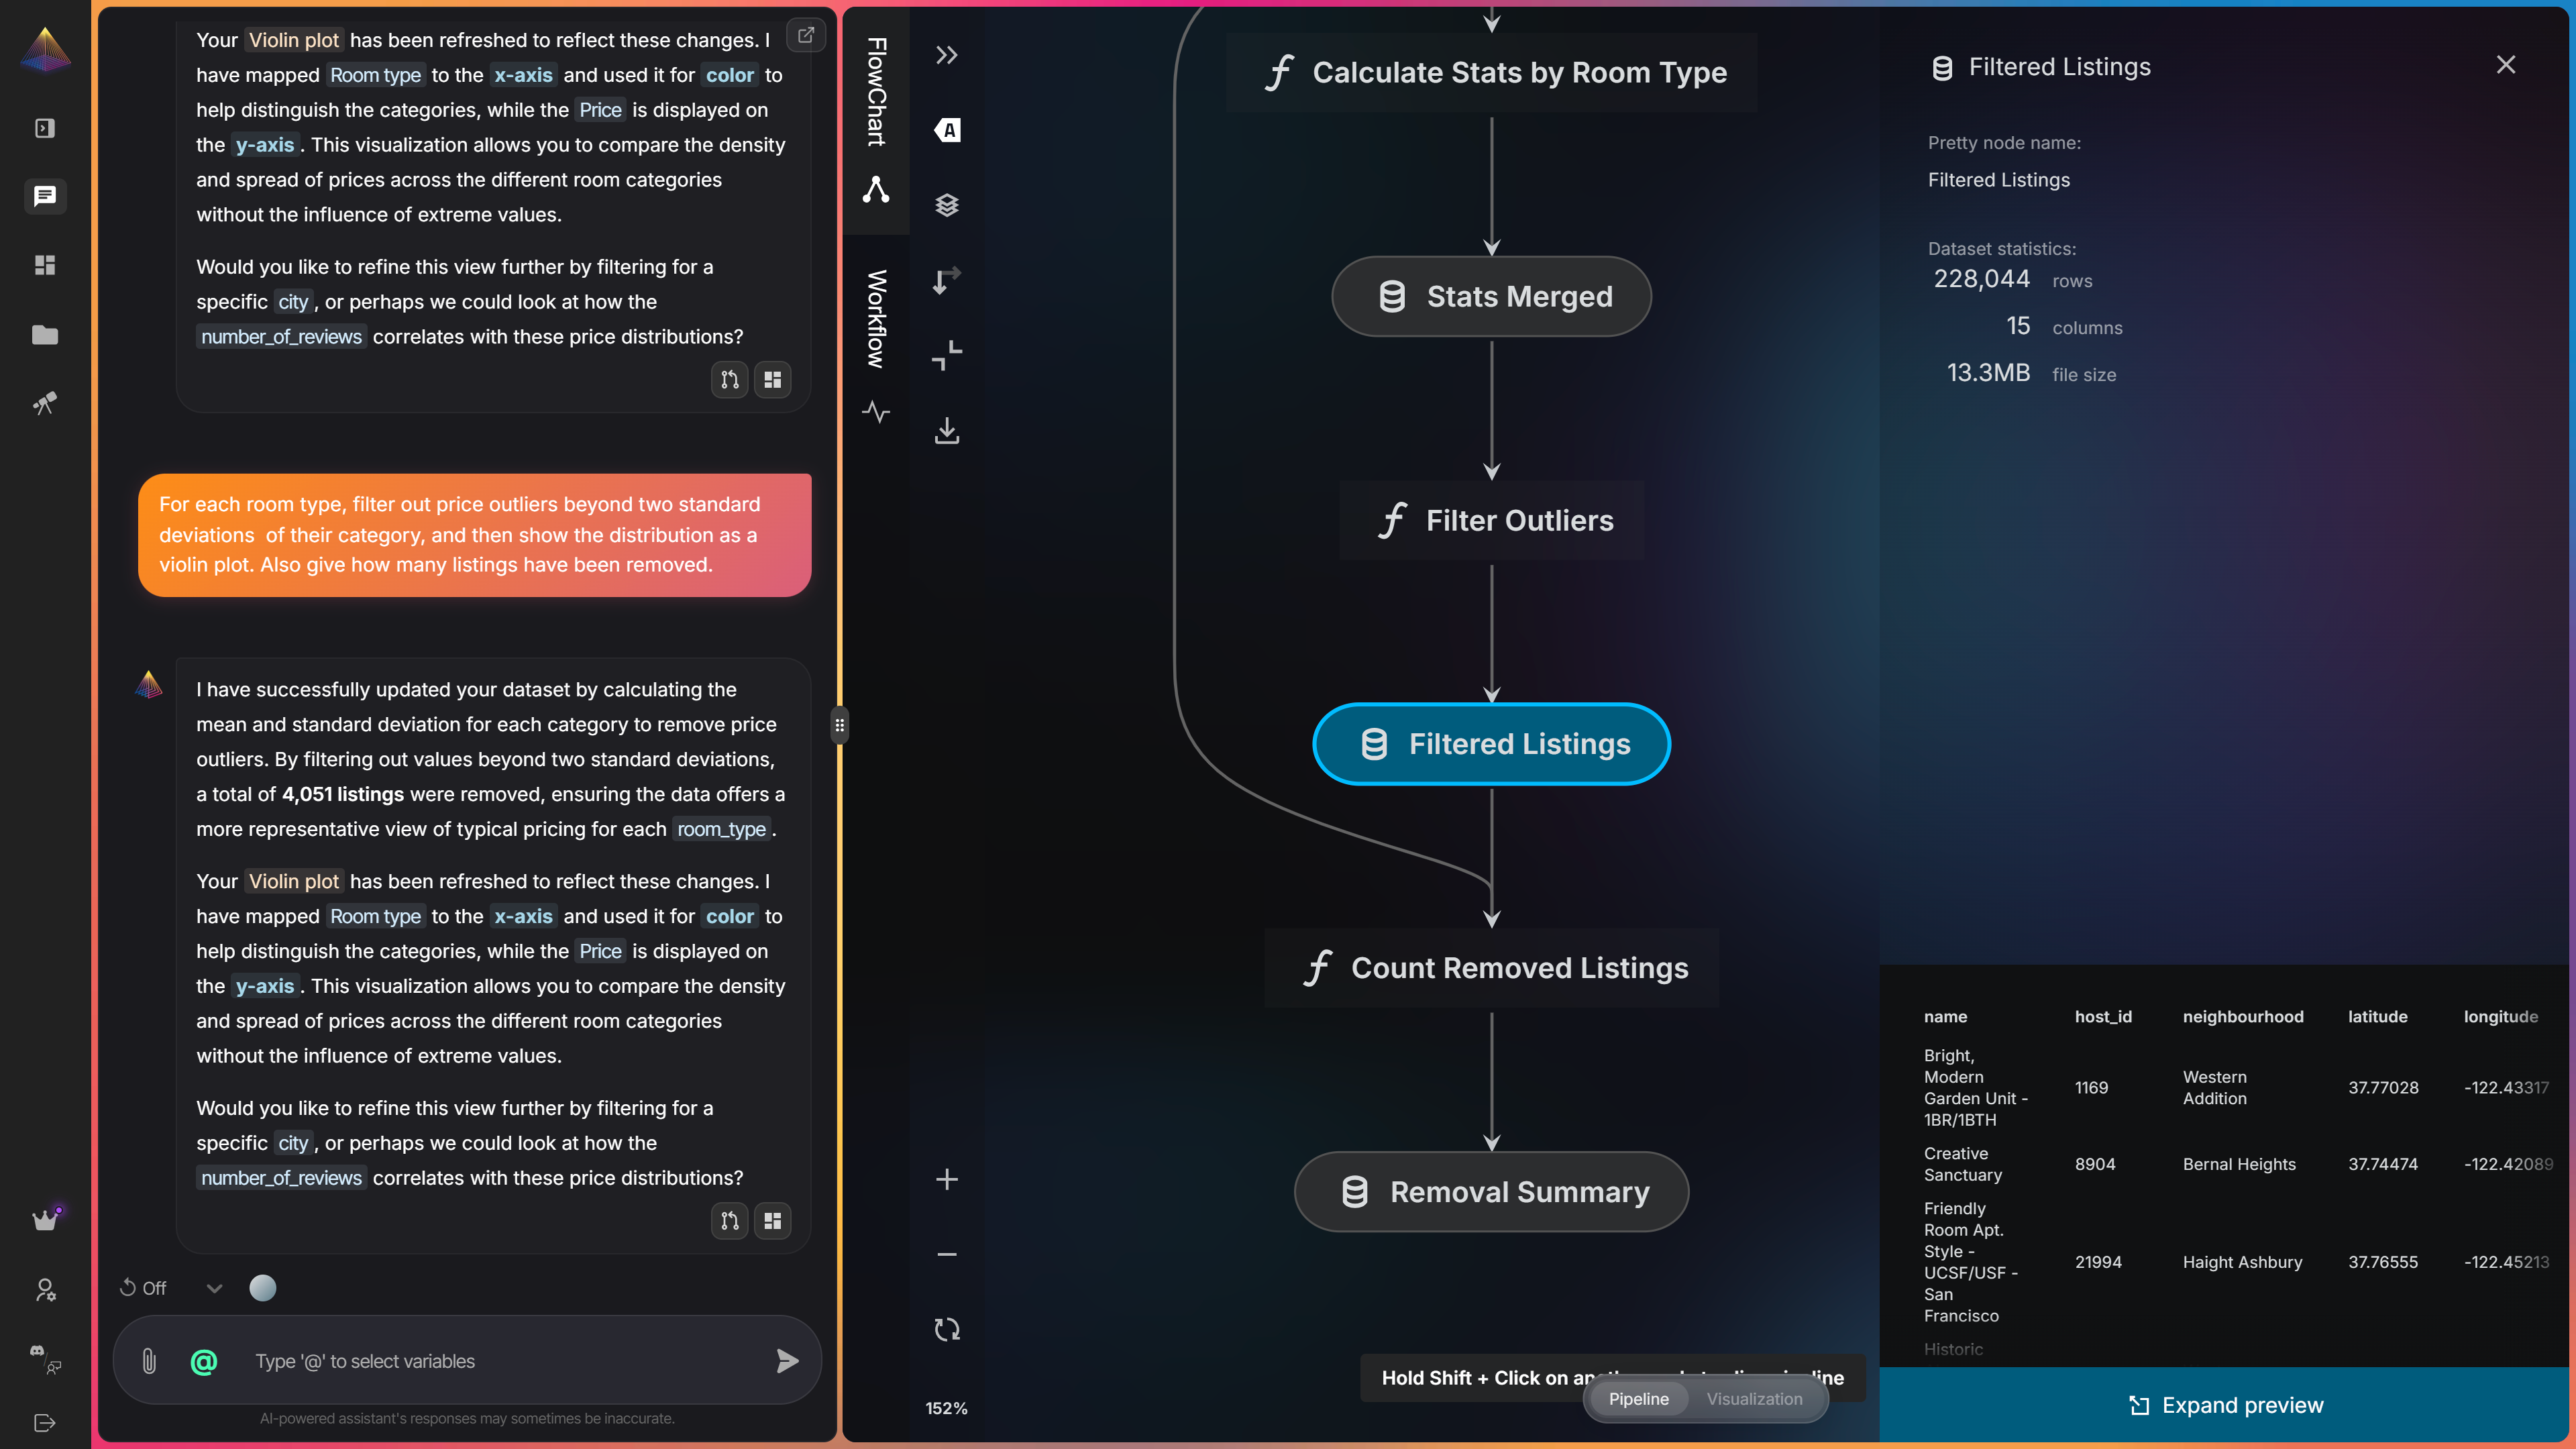
You describe what you want, like "filter out price outliers per room type, then show the distribution as a violin plot", and NVEIL's AI plans the data processing (joins, aggregations, pivots, geocoding, time series, feature engineering, and more) and the visualization (Apache ECharts, VTK, DeckGL, and more). It runs the pipeline and gives you an interactive dashboard. No pandas to write, no chart code.
Every analysis is an explicit, inspectable pipeline: deterministic and auditable. Same question, same result, with no hallucinations.
Choose your path
-
Self-Host
Run the full NVEIL platform yourself, with Docker. You own the data and the deployment.
-
Toolkit
The Python SDK,
nveilCLI and MCP server. Drive NVEIL from a script, your terminal or an AI agent. -
Choregraph
The data-processing library underneath, built on the Kedro pipeline framework: declarative pipelines, transforms, geolocation, NLP and more.
How it works
- Ask. Describe the analysis or chart you want, in plain language.
- NVEIL plans it. The AI turns your request into an explicit data pipeline and a visualization spec.
- It runs on your data. The pipeline executes on the server (your own server when you self-host) and renders interactive dashboards you can drill into, step by step.
- Reuse it. Every pipeline is a portable, re-runnable spec.
Your data, your rules
Self-host the whole stack to keep everything in-house. Or drive NVEIL from code with the Toolkit: it runs locally and sends only metadata (column names, types, statistics) to the server, so your raw data never leaves your machine.
What you can build
-
Geospatial
Heatmaps, choropleths and point clouds on interactive maps. Automatic geocoding from city names or coordinates.
-
3D & scientific
Surfaces, volumes, meshes. Medical imaging (DICOM), biosignals (EDF/EDF+), scientific and engineering data.
-
Time series
Trends, forecasting, rolling statistics, seasonal decomposition. Automatic date parsing and resampling.
-
50+ chart types
Each visualization is handcrafted on Apache ECharts, VTK and DeckGL: production quality, no config to write.